Spring Market
The Spring market is generally the busiest time of the year for real estate transactions. This year however it’s got off to a slow start. This is partly from the poor weather we’ve had over the last 6 weeks but it’s mainly due to the more challenging market conditions for sellers. We are in a solid buyer’s market for virtually all properties types now and this is something we haven’t seen in over 15 years, with the exception of a very short duration in late 2008-early 2009.
The Transition to a Buyer’s Market…
This is a bit of a transitory time as sellers slowly come to the realization that multiple offers are rare these days. Even being priced correctly doesn’t guarantee a quick sale, it may still take some time to get your property sold. Buyers are able to take their time and in many cases, make an offer well below the list price with successful results.
Setting new expectations for home owners
We have become accustomed to double digit percent increases in our property values year after year when historically 2-3% is the norm. For those who haven’t owned before 2003, I know this can be difficult to believe! It’s likely that the coming years will get us back to this state although I’m sure there will be some hiccups along the way. Real estate is a long term investment in your overall investment portfolio. Keep this in mind before worrying about your year over year returns.
Guiding you through this “new normal” takes experience and expert knowledge of the current inventory and recent sales. If you are looking to make a move there are some great opportunities out there but it’s more important then ever to have a Realtor familiar with these market conditions to ensure you get the best price.
We’re here to help you!
If you’d like to have a chat about the possibilities of buying or selling in this market, feel free to contact us anytime. We look forward to hearing from you!
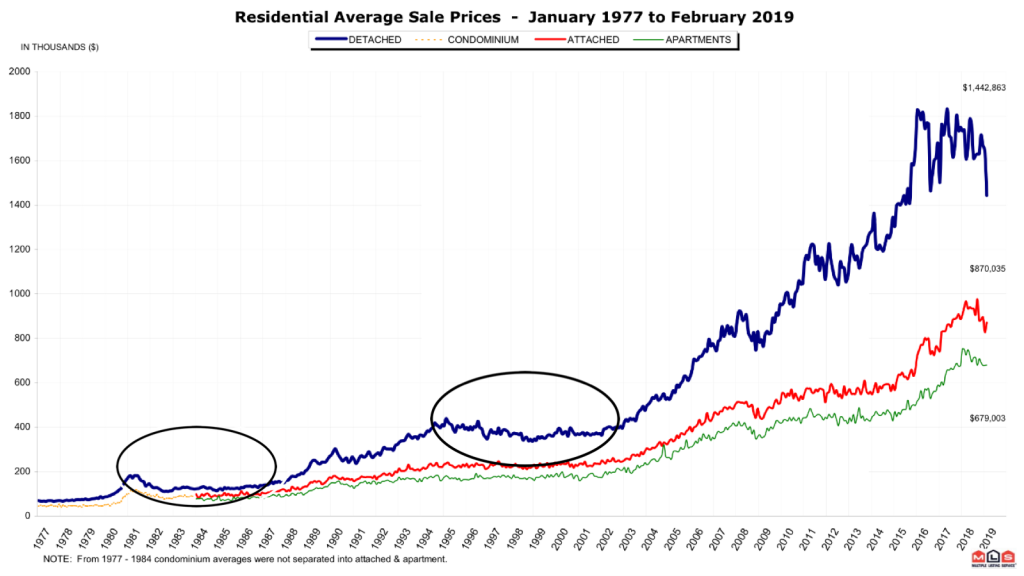
Chart of the Month – What does the future hold?
This longer term chart shows the average sale price in Greater Vancouver since 1977. Although they just look like small blips on this chart, the market tops of 1980/81 and 1994/95, (circled in black) were met with an initial drop in price then a flat-ish market for a few years before heading higher. Although we can’t predict the future, looking at history may give us an idea what to expect in the future. There’s a good chance we will see a similar outcome this time around. Of course every neighbourhood and property is different so if you have any questions, we’d be happy to talk.